Cheese and onion pie
Medium GI
GL 4.2 per typical slice (30 g) · GL 14 per 100 g
- Contains protein from cheese and eggs
- High in saturated fat
Cheese and onion pie has a glycemic index of 55 (Moderate). One typical slice (30 g) adds a glycemic load of 4.2.
Updated Jan 4, 2026 · Sources: Logi Nutrition Team (USDA-derived composition, AI-assisted) · Not medical advice · Report an error
Logi · Manage Insulin Resistance
Lower your blood sugar through smarter food choices
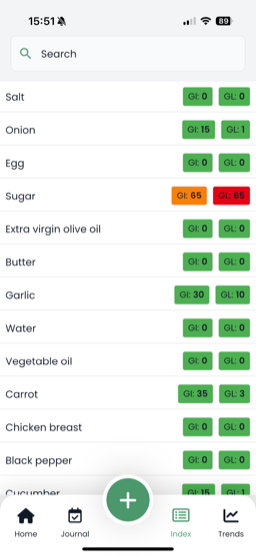
Cheese and onion pie is one of the 11,150 foods Logi scores when you photograph a meal — with the portion.


Nutrition Facts (per 100g)
per 100g
| Calories | 290 kcal |
| Carbohydrates | 25 g |
| Sugars (Total) | 2.5 g |
| Natural | 2 g |
| Added | 0.5 g |
| Fiber | 1.5 g |
| Soluble | 0.5 g |
| Insoluble | 1 g |
| Protein | 8 g |
| Fat | 17 g |
| Saturated | 8 g |
| Unsaturated | 7 g |
| Sodium | 480 mg |
Processing Level
Why this score?
- Contains protein from cheese and eggs
- Provides calcium and B vitamins
- High in saturated fat
- Moderate glycemic load
- Processed flour and added salt
Calculate the glycemic load of a meal with Cheese and onion pie
Allergens
Low-GI recipes on Logi Food Coach
Frequently Asked Questions
What is the glycemic index of Cheese and onion pie?
Cheese and onion pie has a glycemic index of 55 (Moderate). One typical slice (30 g) has a glycemic load of 4.2; per 100 g the glycemic load is 14.
Is Cheese and onion pie good for people with insulin resistance?
Cheese and onion pie has a moderate glycemic index (55). People with insulin resistance can consume it in moderation, ideally paired with protein or healthy fats.
How does Cheese and onion pie affect blood sugar?
Cheese and onion pie has a glycemic load of 14 per 100g, which indicates a moderate impact on blood sugar levels.
Related foods





Check Cheese and onion pie in the Logi app, with your portion.