Bulgur Glycemic Index and Load: Is It Actually a Blood Sugar Safe Grain?
Most people cut out all grains the moment they hear those two words: “watch your blood sugar.” But here’s what catches people off guard: bulgur’s glycemic index is 48. White rice is 72. Even whole wheat bread sits at around 75. And yet bulgur is the one that feels forbidden, lumped in with every other carbohydrate people assume they need to ditch. The truth is more nuanced—and better news for anyone who actually enjoys eating grain-based dishes.
What Bulgur’s Glycemic Index Actually Is (And Why It Matters)
When people talk about the bulgur glycemic index, they’re usually citing a number somewhere between 46 and 48 for boiled bulgur. Some sources report it as high as 55, but the variation typically depends on grain size and variety. The lowest measurements come from whole-grain versions.
To put that in context: white rice lands around 72, brown rice around 55, regular white pasta around 49–55, and whole wheat bread around 69–74. Bulgur slots into that medium-to-lower range—not the lowest, but significantly lower than the grains most people reach for without thinking.
That GI number tells you how quickly a carbohydrate raises blood glucose compared to pure glucose (which scores 100). A GI below 55 is generally considered low to medium. Bulgur clears that bar consistently, which means it won’t trigger the kind of sharp glucose spike that white rice or white bread produces.
But here’s the catch: the glycemic index alone doesn’t tell the whole story. A food can have a low GI but a very high glycemic load if you eat a large portion. For bulgur, that’s where the real reassurance comes in.
The Parboiling Secret: Why Bulgur’s GI Is Lower Than Expected
This is where most articles stop explaining and start generalizing. They’ll say bulgur is a “whole grain” with “fiber” and leave it at that. But the actual reason bulgur has a better glycemic profile than regular whole wheat flour or white rice has to do with its processing method—a method so old and so effective that it’s been used for centuries across the Mediterranean and Middle East.
Bulgur is made by parboiling whole wheat, then drying it, and cracking it into small pieces. That parboiling step—where the whole grain is partially cooked and then dried—fundamentally changes the starch structure in the grain. Research from a study on traditionally processed cereal foods found that this processing method resulted in low GI values “associated with the unmilled cereal,” even after it had been dried and cracked. In other words, the processing preserves the low-glycemic characteristics of the whole grain rather than destroying them, which is the opposite of what happens when wheat is milled into flour.
During parboiling, the heat and moisture cause the starch molecules to gelatinize and partially retrograde—they reorganize in a way that makes them less immediately accessible to your digestive enzymes. Think of it like rearranging furniture in a room so that certain pieces become harder to reach. When you then dry the grain, some of that structural change sticks around. The result is resistant starch: starch that your small intestine can’t break down quickly, at least not without the help of your large intestine’s bacterial community.
Research on the resistant starch content of bulgur found that industrial samples contain between 2.1 and 2.8 percent resistant starch naturally. That might sound small, but resistant starch is significant from a metabolic perspective. It’s the type of carbohydrate that passes through your small intestine largely undigested, reaching your large intestine where it feeds beneficial bacteria—and critically, doesn’t spike glucose in the immediate 2–3 hour window after eating.
You can even increase bulgur’s resistant starch content further through specific preparation methods. Recent research has explored using enzyme treatment and autoclaving-cooling cycles to produce bulgur with up to 9.5 percent resistant starch—nearly triple the natural amount. That experimental bulgur still maintained a low GI of around 52, suggesting there’s room to improve the already-favorable glycemic profile.
This is the mechanism most generic “bulgur vs. rice” articles skip entirely. They notice the GI difference but don’t explain why. It’s not magic; it’s chemistry and processing. And understanding the why is what transforms bulgur from “just another grain” into a genuinely useful tool for anyone managing their blood sugar.
Glycemic Load: Why Portion Size Matters More Than You Think
Here’s where your actual meal glycemic impact becomes clear: the glycemic load of bulgur per serving.
The glycemic load accounts for both the GI and the total amount of carbohydrate in a typical serving. It’s calculated as: (GI × grams of carbs per serving) ÷ 100.
For bulgur (cooked, GI of 47), a 150-gram serving contains approximately 28 grams of carbohydrates. That gives a glycemic load of approximately 13—solidly in the medium-low range. Foods with a GL under 10 per serving are considered low, 11–19 is medium, and 20+ is high. A 150-gram serving of cooked bulgur puts you right at the boundary between medium-low and medium.
To compare: a 150-gram serving of white rice (GI 72, ~28g carbs) has a GL of around 20—a medium glycemic load. Brown rice (GI 55, ~28g carbs per 150g) has a GL of about 15. So bulgur actually edges out brown rice on the glycemic load metric for the same serving size.
This matters because it means a modest portion of bulgur—roughly the size of a closed fist—won’t spike your blood sugar in the way a larger portion might. If you’re monitoring your blood sugar response to meals, the GL per serving is what actually predicts your glucose curve.
Since you’re likely already thinking about portion size in individual meals, using a tool that calculates glycemic load per plate automatically removes the guesswork. Logi calculates glycemic load per meal automatically—you scan the plate, it does the math, and you see the actual glucose impact without building a spreadsheet.
Bulgur vs. Brown Rice vs. White Rice: The Numbers in Context
People often ask: “Why not just eat brown rice instead?” It’s a fair question. Here’s how they stack up side-by-side.
White rice: GI 68–72, GL per 150g serving ~20. This is the baseline for what most people ate before cutting grains entirely. It spikes blood sugar noticeably.
Brown rice: GI 50–55, GL per 150g serving ~15. Better than white rice because the bran layer slows digestion. Still a solid choice.
Bulgur (cooked): GI 46–48, GL per 150g serving ~13. Similar to brown rice but slightly lower on both metrics. The parboiling history gives it an edge.
None of these grains are “unsafe” for someone with stable blood sugar. The difference between bulgur and brown rice is perhaps 10–15 percent lower glycemic impact—real, but not dramatic. Where it becomes meaningful is for people with insulin resistance or prediabetes, where even a modest reduction in glucose spikes can accumulate into meaningful metabolic improvements over time.
One more comparison worth noting: pasta (regular wheat pasta) sits at GI 49–55 with a GL around 15–17 per 150g serving. Bulgur and pasta are actually quite similar metabolically, though bulgur is less processed and has a slightly lower GI baseline.
The practical takeaway: if you’re choosing between white rice and bulgur, bulgur wins clearly. If you’re choosing between brown rice and bulgur, the difference is small enough that taste, texture, and how it fits your meal composition matter more than the glycemic difference.
How to Eat Bulgur to Keep Blood Sugar Even More Stable
The glycemic load of your meal isn’t determined by bulgur alone. Pairing matters—a lot.
Combining bulgur with protein, healthy fat, and additional fiber dramatically flattens your glucose response. Here’s the mechanism: fiber slows the rate at which glucose enters your bloodstream, protein triggers satiety hormones and blunts the glucose spike slightly, and fat slows gastric emptying, delaying carbohydrate absorption into your bloodstream.
A 150-gram serving of cooked bulgur contains about 3 grams of fiber and 3 grams of protein. That’s a decent start, but not enough to fully blunt a glucose response on its own.
Practical pairings:
- Bulgur tabbouleh with olive oil (fat), chickpeas or grilled chicken (protein), and lots of parsley and tomato (additional fiber and polyphenols)
- Bulgur pilaf with lentils (protein + fiber), sautéed in olive oil with onions and spices
- Grain bowl: bulgur base, roasted vegetables, grilled salmon or tofu, avocado
Each of these combinations takes the GL of the bulgur and distributes the glucose rise over a longer period. Research on the combined effects of macronutrients shows that meals high in protein and fat relative to fast carbs produce flatter glucose curves than carbohydrate-dominant meals—even when the carbohydrate is low-glycemic to begin with.
Portion size still applies. A realistic serving is about one-third to one-half cup of cooked bulgur per meal. Going beyond that—eating a full cup without other components—will increase your glycemic load back into the medium-to-high range.
Who Should Still Be Cautious With Bulgur
This is important: bulgur is not a free food for everyone.
For people with type 2 diabetes or significant insulin resistance, even medium glycemic loads can accumulate if you’re eating three meals a day with similar profiles. If your current diet involves high-GL meals at every eating occasion, adding bulgur doesn’t fix the problem—it only reduces the severity slightly. The metabolic impact compounds: a 15-unit GL three times a day is 45 units total, which is still more than your blood sugar regulation system wants to handle repeatedly.
Additionally, bulgur contains gluten (it’s wheat). For people with celiac disease or non-celiac gluten sensitivity, this is a disqualifier regardless of glycemic properties. No glycemic advantage overcomes the intestinal damage that gluten triggers in those populations.
The other consideration is individual glucose response variability. Most glycemic index and load data come from studies of 8–12 healthy adults, often in controlled laboratory settings. Your own glucose response to bulgur might be slightly higher or lower based on several factors: your individual insulin sensitivity, your gut microbiota composition, your habitual diet, and how often you’ve eaten that food before. Someone with dysbiosis or very severe insulin resistance might see a sharper response than the published GI suggests.
If you have a continuous glucose monitor (CGM), testing bulgur yourself—especially prepared the way you’d actually eat it, with your typical pairings—is far more informative than any general guideline. Your personal data trumps population averages every time.
The Bottom Line: Bulgur Isn’t the Enemy
The initial assumption—that bulgur, like all grains, must be restricted—comes from good instinct. Modern wheat products have been engineered toward higher carbohydrate yield and lower nutrient density. But bulgur is an exception. The parboiling process and partial pre-cooking during production genuinely lower its glycemic impact compared to most grain products. Its GL per serving is medium-low, not medium-high.
This doesn’t mean you should eat unlimited bulgur. Portion control and pairing still matter. But it does mean bulgur deserves a place on the table for anyone told to “watch their blood sugar”—especially if you’re tired of restricted eating and want a grain that actually has a mechanistic reason to be gentler on your glucose response.
Start with a realistic portion (one-third to one-half cup cooked), pair it with protein and fat, and track how you feel. If you want to start applying this without building a spreadsheet, Logi scans meals and shows you the glycemic load per portion alongside a 3-hour glucose prediction. Available on iOS and Android.
Sources
[Glycemic Index of Bulgur - Nutrition Facts & Health Benefits (Signos)](https://www.signos.com/foods/bulgur-glycemic-index)
[Low glycemic response to traditionally processed wheat and rye products: bulgur and pumpernickel bread (PubMed)](https://pubmed.ncbi.nlm.nih.gov/3962904/)
Glycemic Index of Grains Complete Chart (Glycemic Index Guide)
Bulgur Glycemic Index (GI) - Is It High or Low? (FoodStruct)
The Great Showdown: Bulgur vs. Rice? (Analysis for Diabetes and Diet) - Nefis Agro Bulgur
Take control of your blood sugar
Scan your meals, track glycemic load, and see your patterns — all in one app.
무료 체험 시작 →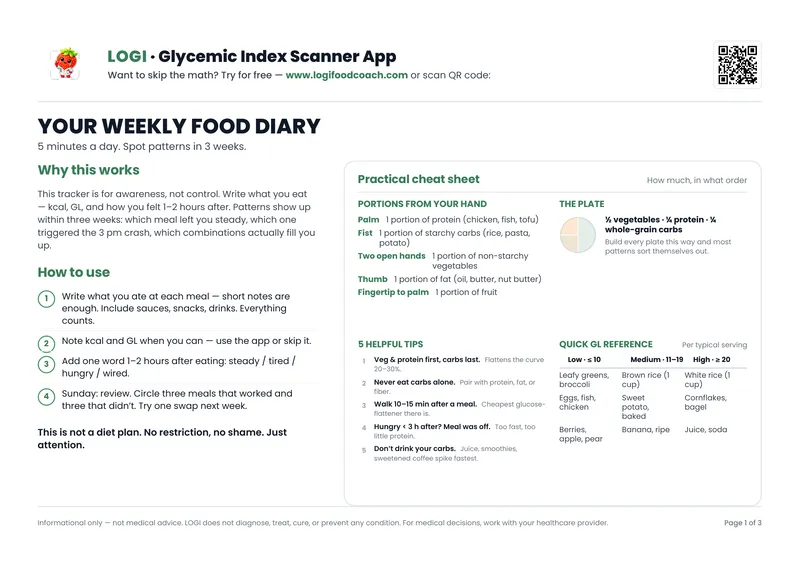
무료 PDF — 3페이지
주간 식단 일지
식사, 혈당 부하, 기분을 기록하세요. 3주 만에 패턴이 보입니다.
스팸 없음. 언제든 구독 취소.