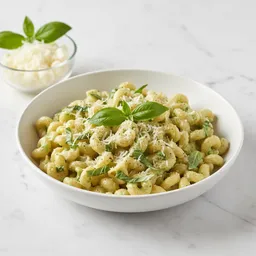
Cheese-basil pasta
Logi · Manage Insulin Resistance
Lower your blood sugar through smarter food choices
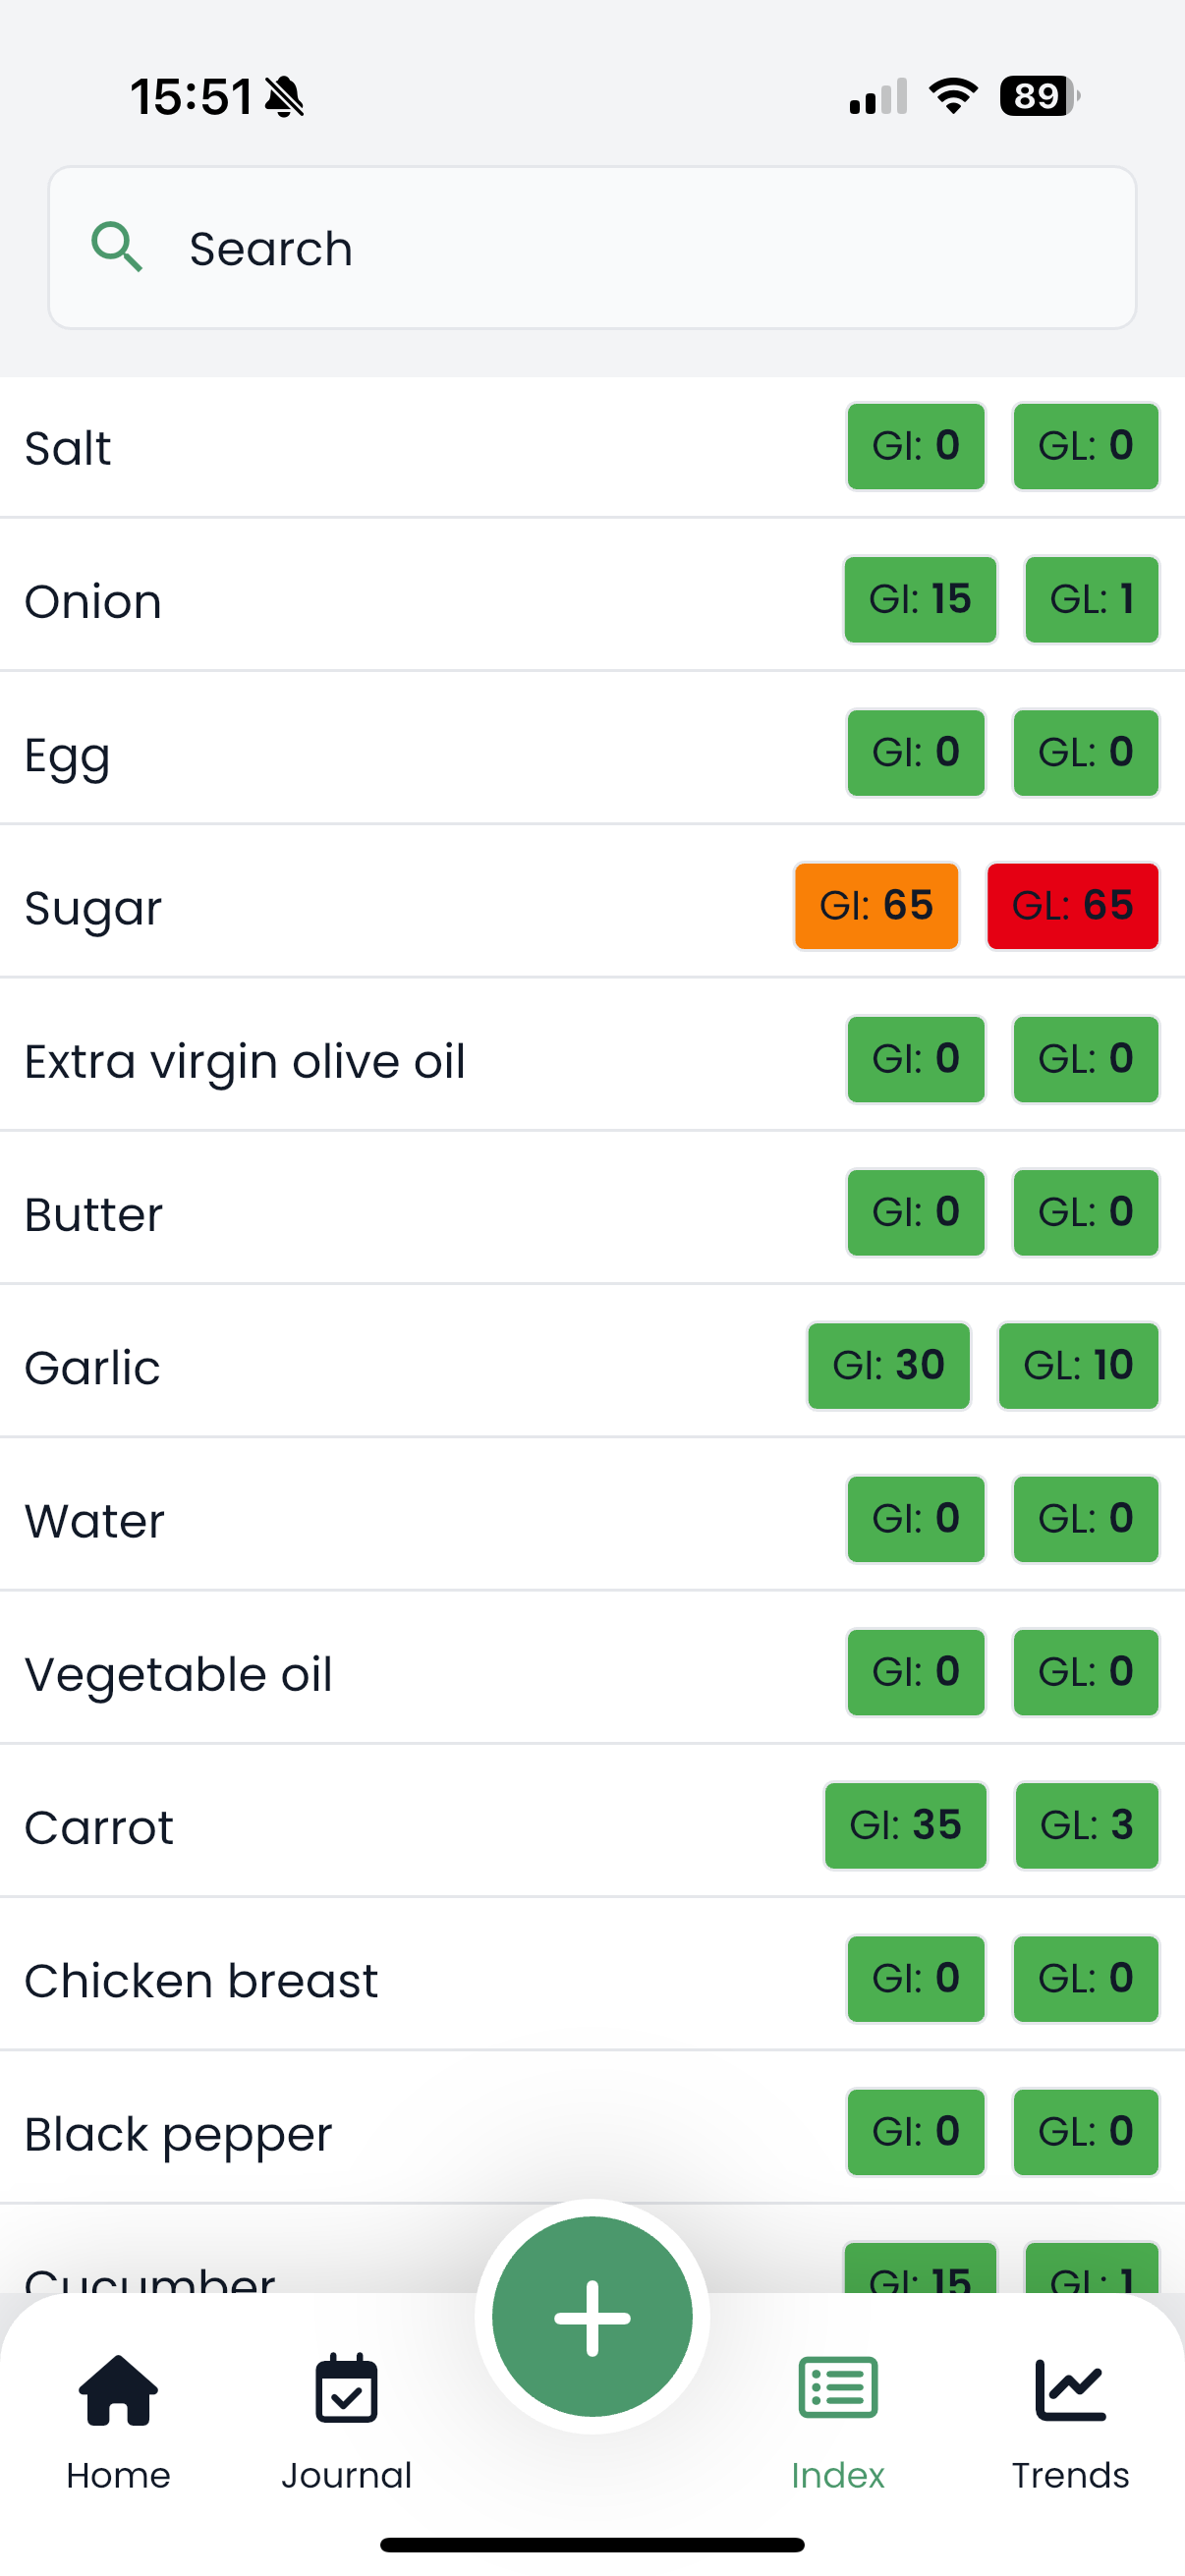
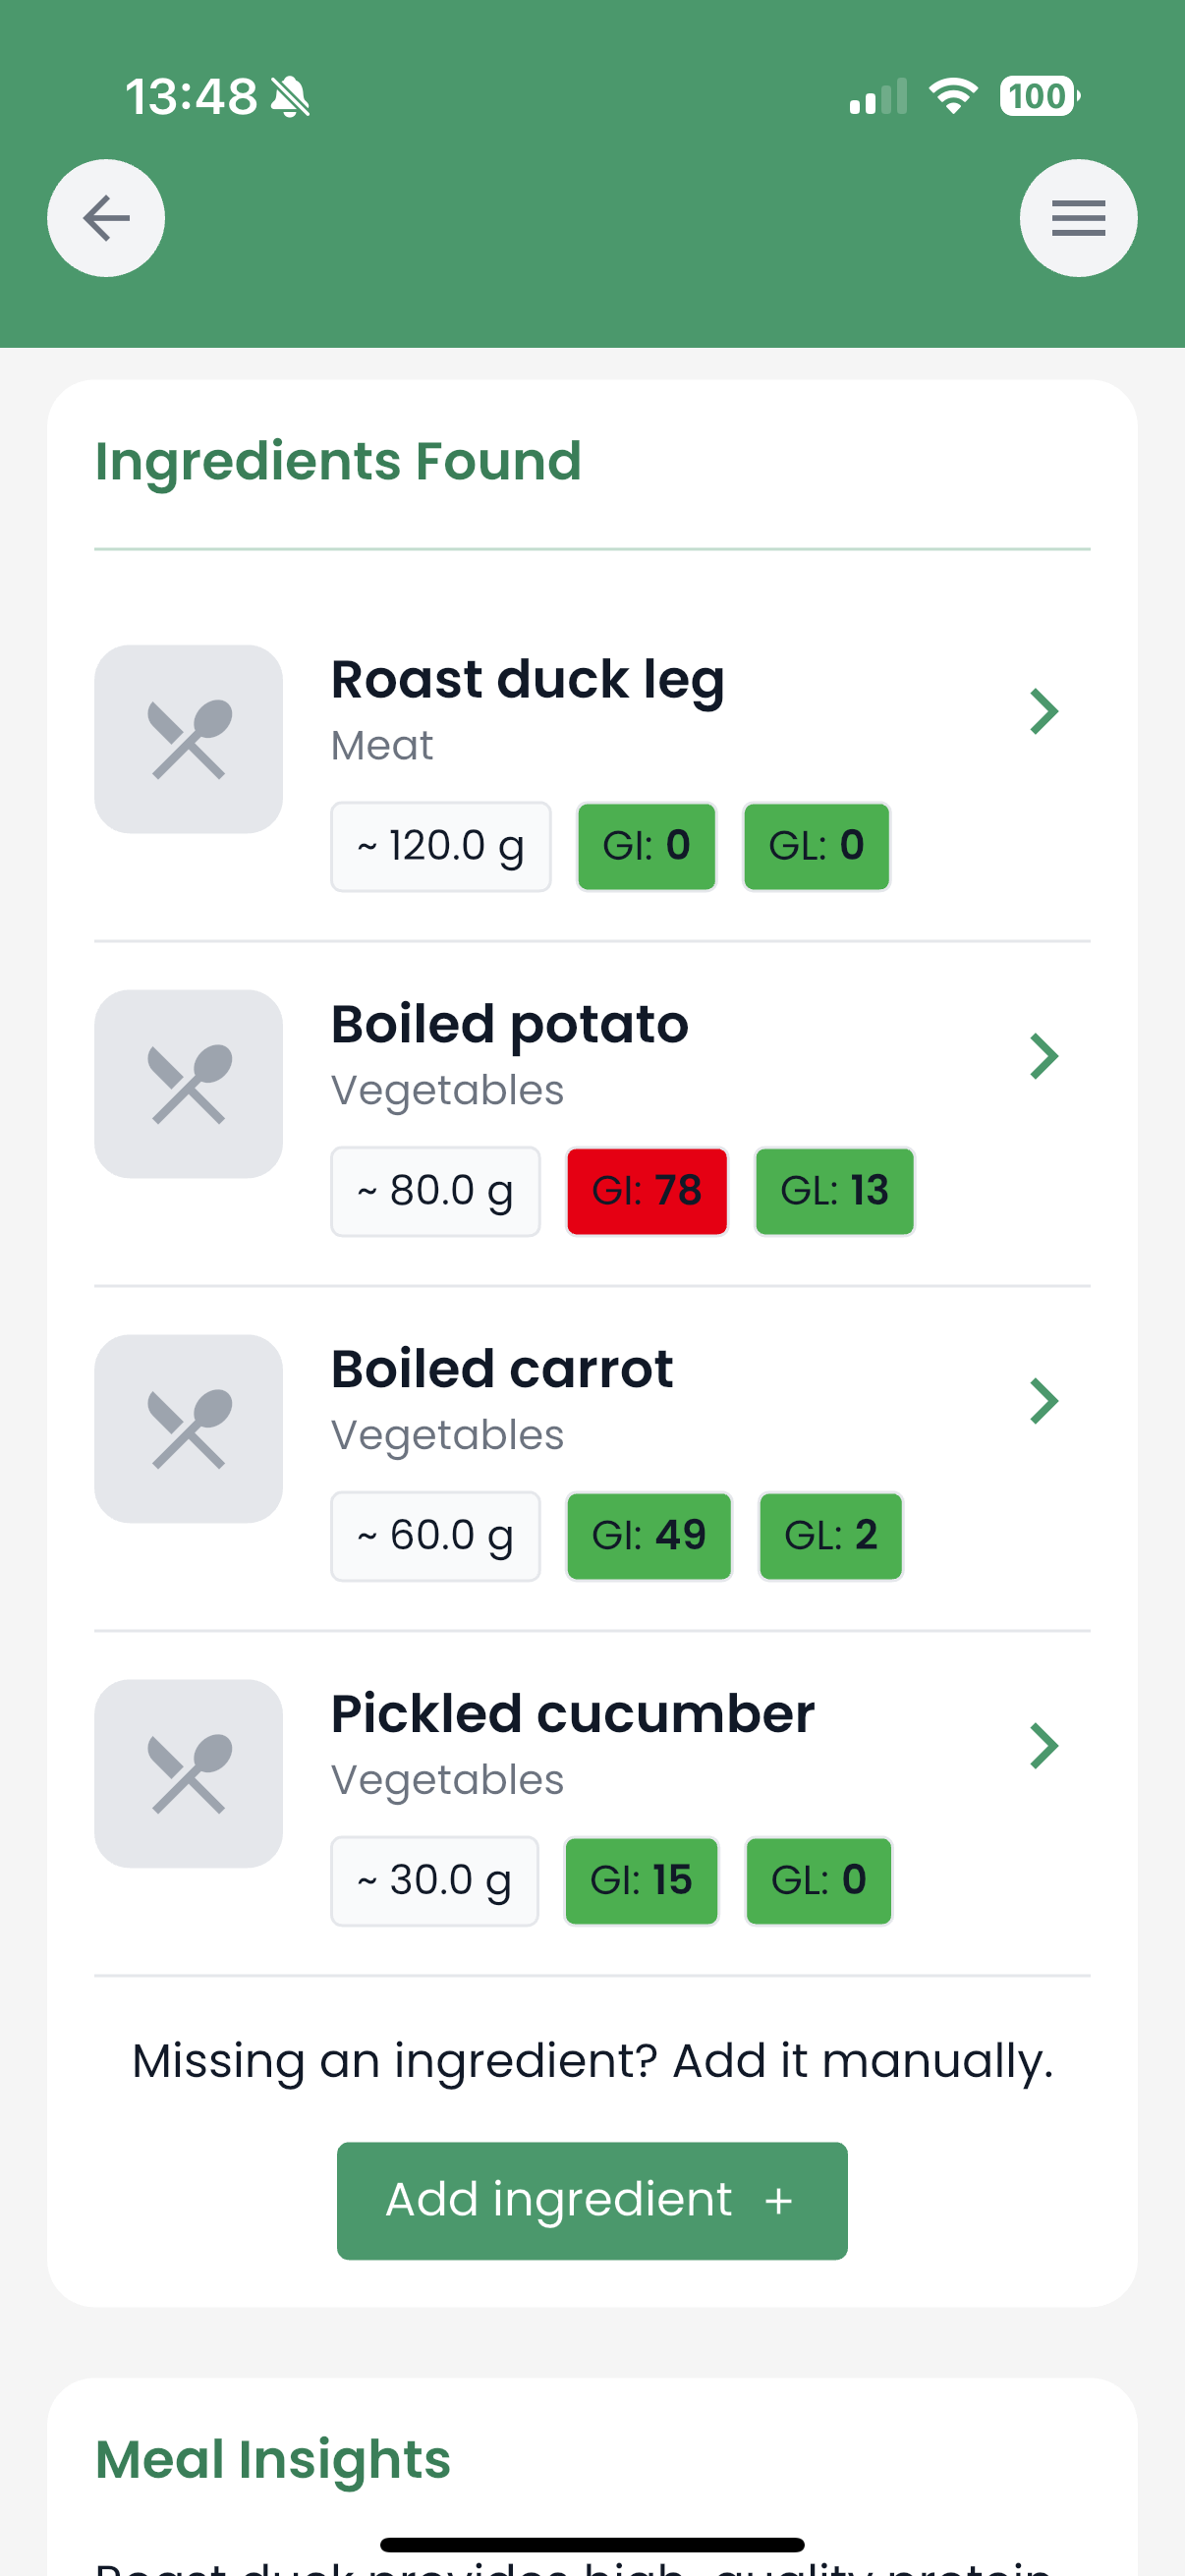
Logi scans your meals, calculates glycemic load in real time, and shows you exactly how each ingredient affects your blood sugar — so you can eat better without guessing.
Start for free →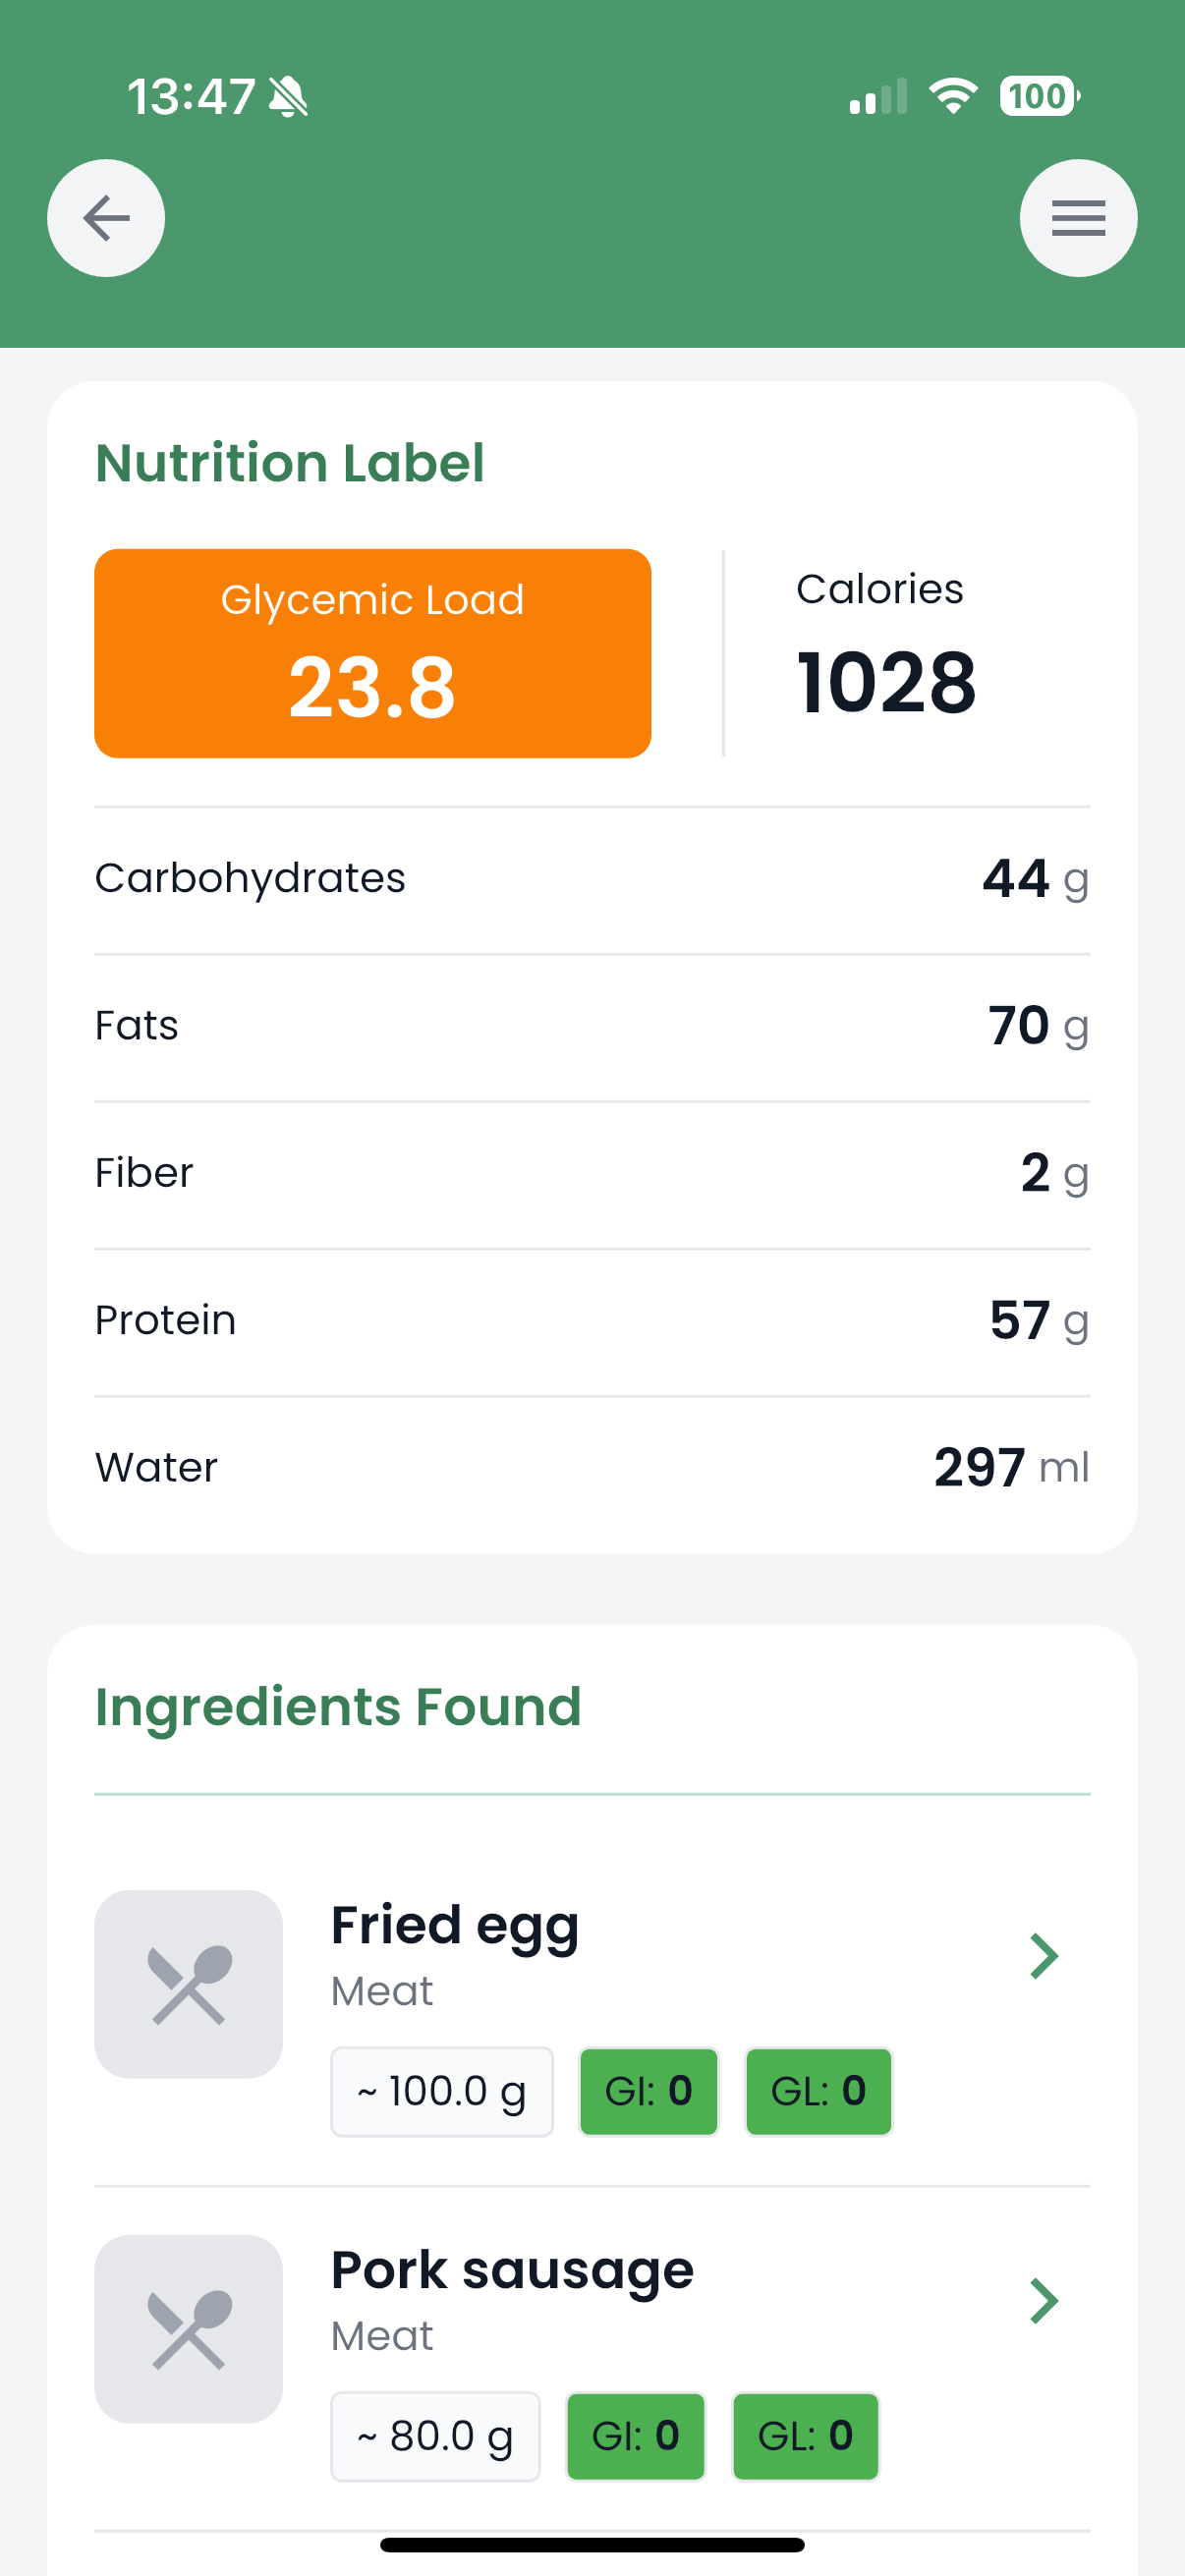
Cheese-basil pasta has a glycemic index of 55, which classifies it as a moderate GI food. With a glycemic load of 15 per 100g, it has a moderate impact on blood sugar.
Compared to other grains, Cheese-basil pasta ranks above average in glycemic index.
Cheese-basil pasta is suitable in moderation for people monitoring blood sugar levels.
Logi Score: 6/10
Why this score?
- ✓ Source of plant protein
- ✓ Moderate amount of fiber
- ✓ Low content of saturated fats
- ✗ Average glycemic load
- ✗ Moderate level of processing
- ✗ Not very high fiber content
Processing Level
Nutrition Facts (per 100g)
| Calories | 180 kcal |
| Carbohydrates | 27g |
| Sugars (Total) | 2g |
| Natural | 2.0g |
| Added | 0g |
| Fiber | 3.5g |
| Soluble | 1.1g |
| Insoluble | 2.4g |
| Protein | 7g |
| Fat | 4.5g |
| Saturated | 2g |
| Unsaturated | 2.5g |
| Sodium | 180mg |
Frequently Asked Questions
What is the glycemic index of Cheese-basil pasta?
Cheese-basil pasta has a glycemic index of 55, which classifies it as a moderate GI food. With a glycemic load of 15 per 100g, it has a moderate impact on blood sugar.
Is Cheese-basil pasta good for people with insulin resistance?
Cheese-basil pasta has a moderate glycemic index (55). People with insulin resistance can consume it in moderation, ideally paired with protein or healthy fats to slow glucose absorption.
How does Cheese-basil pasta affect blood sugar?
Cheese-basil pasta has a glycemic load of 15 per 100g, which indicates a moderate impact on blood sugar levels. The glycemic load accounts for both the quality and quantity of carbohydrates.
Logi · Manage Insulin Resistance
Lower your blood sugar through smarter food choices
Logi scans your meals, calculates glycemic load in real time, and shows you exactly how each ingredient affects your blood sugar — so you can eat better without guessing.
Start for free →